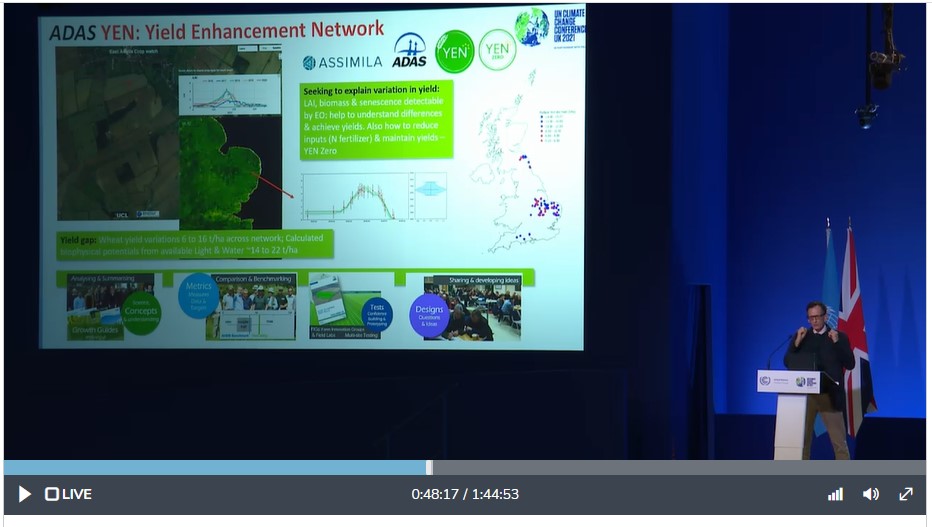
In the YENs we have long seen the potential value from using satellite derived Earth Observation data to get useful information to monitor and compare crops. We have involved the YEN in several projects over the past six years, and this has now been showcased by Prof Lewis of UCL at COP26 Earth Information Day, pictured above. You can watch the session at the link below, the YEN is mentioned at around 44 minutes https://unfccc-cop26.streamworld.de/webcast/presidency-event-earth-information-day
From 2015 to 2020 ADAS was involved in the EU Horizon 2020 project MULTIPLY with partners UCL and Assimila, that developed new approaches to assimilating data from the new Copernicus Sentinel 1 & 2 satellites into time series of vegetation series like Leaf Area Index. These metrics were generated for multiple YEN crops and related to yields achieved to see if satellite data could help distinguish between high and low yielding crops, which it did. It is now possible to generate time series of crop growth like above for any field any where in the world, such as the below LAI time series created by UCL.
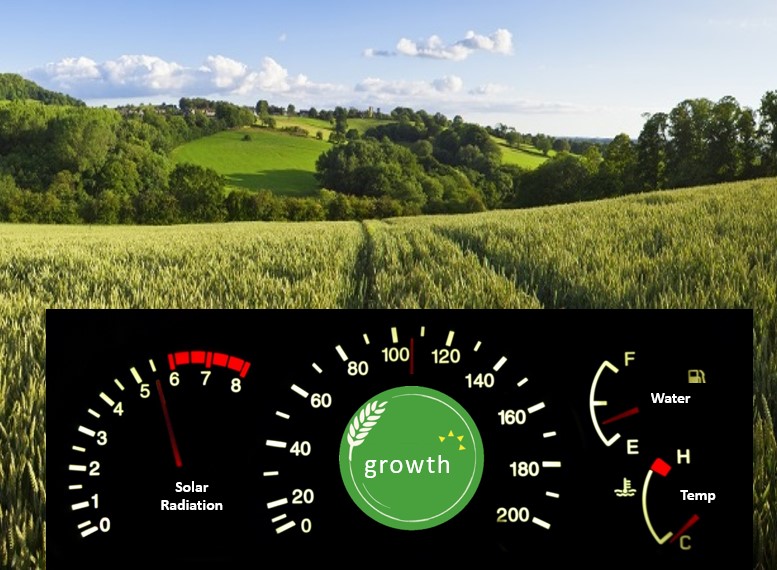
In 2017 we developed ideas for creating a dashboard of crop growth in a Crop Intelligence System (below).
We have now been successful with Assimila with a UK Space Agency grant to operationalise a system for providing useful crop metrics for individual fields, and enabling comparisons through the development of Dynamic Benchmarking. We will use YEN data for calibration and validation of the system, and we will be looking for interested farmers to get involved in co-designing and testing any new tools. Ultimately we aim to deliver this through Farm-PEP.
We are planning to run this through a Crop Monitoring Club where we bring farmers and stakeholders together who are interested in monitoring and comparing their crops. If you'd be interested in getting involved in this then please get in touch.