Eligibility
No – YEN Nutrition operates independently of the other YENs. You need to fund YEN Nutrition membership separately from any involvement in the other YENs. You will still receive the grain nutrient analyses for your YEN entry, but this will only be benchmarked against other entries in the same YEN
Yes, but please recognise that your results will mainly be benchmarked against crops grown in UK conditions.
You can register on their behalf, and if you register ten farms or more, you need not pay on-line. Just fill in the form for bulk entries and we will email you with a discounted invoice and a bulk entry form for all Field Details.
YEN Nutrition aims to be collaborative, not competitive. It is open to anyone and aims to maximise engagement with all those growing arable crops because this will maximise the value of any benchmarks. Agronomy companies can use YEN Nutrition benchmarking within their own services. If you cannot persuade your agronomy company to engage with YEN Nutrition, you can show them the value of YEN Nutrition by becoming an independent member.
YEN Nutrition is all about maximising your ability to make comparisons between grain analyses (because only a few critical values are certain) hence we have set a minimum sample number of six. To ensure you can make comparisons we suggest that you submit more than one sample per field (i.e. split a field into contrasting zones), or you persuade a neighbour to contribute samples to your membership, so that the total number of samples registered is at least six
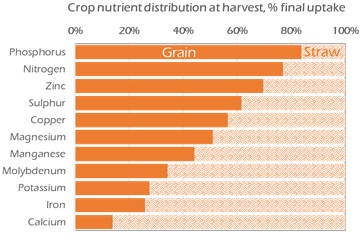 On many fields straw is not removed at harvest so grain nutrient offtakes are the only concern. Straw nutrient levels are usually reflected in grain nutrient levels, so grain levels provide the better diagnostic of crop status. Data for wheat show that straw contains most of a crop’s uptake of Potassium, Calcium, Iron, Manganese and Molybdenum, whilst grain contains most Nitrogen, Phosphorus, Sulphur, Zinc & Copper, with Magnesium shared equally. The value of straw analysis will be tested in the YEN, prior to its possible inclusion in YEN Nutrition in future years.
YEN Nutrition is only addressing grain crops –any cereal, oilseed or pulse crop.
YEN Nutrition is a knowledge-building network, just like the other YENs, and it uses a similar benchmarking approach, but YEN Nutrition operates independently of the other YENs. YEN Nutrition enables you to monitor many more fields with less intensity, so much more easily. Because YEN Nutrition will include many more fields than the other YENs, it will provide more precise benchmarks for grain nutrients. However, it will have fewer explanatory metrics per field. YEN Nutrition will collect soil details, crop details and grain yields, as well as grain analysis results; but yield measurements will be less exacting than for the other YENs..
Registration
Soil availability of Phosphate (P2O5) and Potash (K2O) is commonly maintained by adding enough of these nutrients to replace what has been removed in the recently harvested grain and in any removed straw or haulm.
Until 2020, advice was to assume cereal grains contained 7.8 kg/t P2O5 and 5.5 kg/t K2O. However, data from the YEN and elsewhere show average wheat P2O5 is 6.5 kg/t and that contents of both nutrients vary two-fold, so grain analysis is needed to achieve precise, cost-effective nutrient replacement.
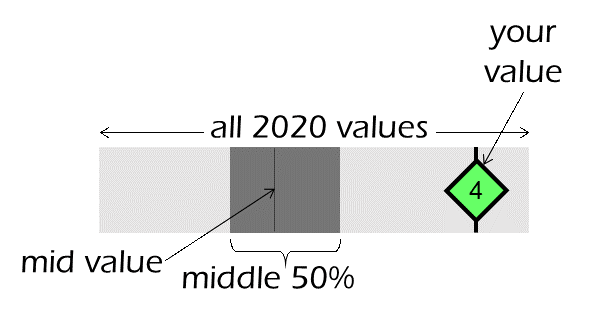
Benchmarking helps to gauge whether a crop acquired enough of all essential nutrients. Because grain analysis is new, critical thresholds for some nutrients are unknown or uncertain. So the best way to tell whether a crops’ nutrient levels were satisfactory is to benchmark them – i.e. gauge how each result ranked against all similar crops in the same season. To enable robust comparisons, we will report for each nutrient the maximum and minimum from all similar crops, the middle 50% of values and the mid-value.
We will have benchmarks for all essential nutrients and all common crop species: wheat, barley, oats, oilseed rape, faba beans and combinable peas. Benchmarks for minor crops (e.g. triticale, rye or soybeans) will be provided if the number of crops submitted exceeds twenty. From 2021 we expect to offer interactive benchmarking i.e. members can go on-line and choose benchmarks tailor-made to their own conditions, interests or questions. E.g. How did my values compare to all wheat crops yielding over 14 t/ha?
It is always best to keep using the same lab for the same types of samples. If you have already had grain analyses by one lab, then it will be best to use the same lab for YEN Nutrition in future. If you don’t mind which lab you use, we will select labs alternately for successive YEN Nutrition registrations.
Not all Field Details are essential to register a field, but the fewer data that you provide, the less precise your benchmarking can be, and the less you will learn from the YEN Nutrition Review.
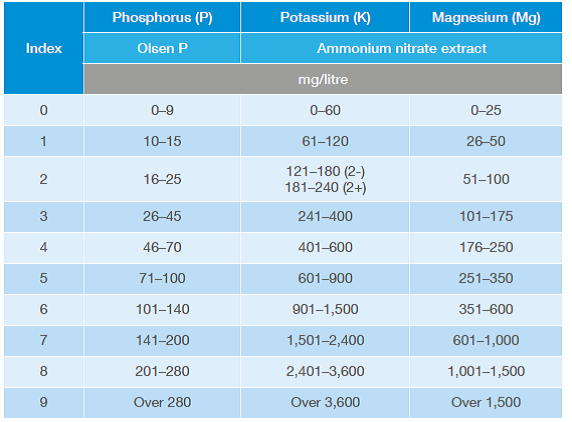
If you only know an Index level, please fill in the mid-value for that Index from one of the following tables:
 England, Wales and Northern Ireland (RB209)
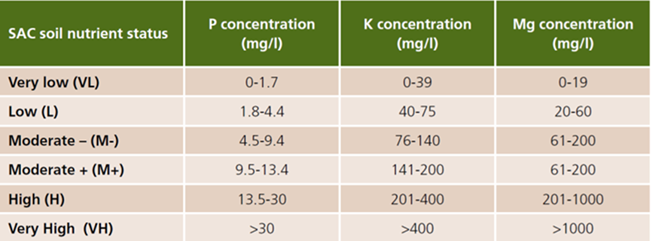 Scotland (SAC)
Either enter two samples per field – one from the zone with lowest soil P and the other from zone with lowest soil K – or enter one grain sample to represent the whole field and report the most representative soil P & K levels from the soil maps.
You need to plan the whole process well before harvest comes – Make sure all the necessary equipment and instructions are available at the farm’s grain intake point, and that all harvest staff know how to take the samples.
As yields vary hugely, nutrient offtakes also vary hugely. Even with grain analysis, estimates of nutrient offtake can only be as accurate as the accuracy of the grain yield on which they depend. Your reported yields will be used to detect whether specific nutrients were associated with grain yield levels. So far the YEN has shown that grain phosphorus was associated with higher grain yields and sometimes also magnesium.
After harvest you must divide the weight of grain harvested from each field by the area harvested and record the result in tonnes per hectare and the grain moisture content via this website. We will adjust your yields for moisture content, if this is much different from the standard 15%. If you forget to record accurate yields, we cannot report accurate nutrient offtakes. We will ask you how you estimated your yields, and we will give more emphasis in the YEN Nutrition Review to farms using the most accurate methods – weighbridge or calibrated yield monitor.
All YEN Nutrition data will be held according to the YENs’ Data Privacy Policy. We will always maintain your data in anonymity.
Value for money
Grain analysis just reports your own results as concentrations; YEN Nutrition reports both offtakes (because you enter your yields) and benchmarks i.e. it reports everyone’s results compared with your own, so is much more informative. The labs must rely on standard thresholds to gauge whether your nutrient levels were deficient. But, because grain analysis is new, few critical thresholds are known. Benchmarking provides a reliable way of gauging the sufficiency of each nutrient, and it is adjusted for seasonal (and potentially other) effects. Because YEN Nutrition records grain yields, it will ultimately be able to develop critical thresholds for all grain nutrients. YEN Nutrition will ultimately provide perpetual, dynamic and independent support for optimal management of all nutrients for all crops.
Based on YEN grain samples analysed over the last four seasons, we estimate that fertiliser savings based on accurate measurements of P2O5 and K2O offtakes would have benefited each entrant on average by about £50 for each field. We also estimate that, on average, YEN entrants would have benefited by at least £500 per field if they had achieved completely optimal nutrition. YEN Nutrition enables the first step in understanding how crop nutrition could be optimised on each field. In future seasons additional YEN Nutrition services will enable the further steps you will need to take toward optimising arable crop nutrition, including patch testing to prove deficiencies, and independent product comparisons.
Nitrogen (N) and phosphorus (P) are the two nutrients most concentrated in cereal grains, and they are the two nutrients causing most environmental impacts. Grain nutrient concentrations indicate the extent to which you managed to optimise crop N & P uptakes. Through routine grain analysis, farms can learn faster how to optimise these nutrients, hence how to minimise their environmental impacts without constraining crop growth and yield.
Based on grain analyses in the YEN over the last four seasons, we estimate that the yields of three quarters of YEN crops were constrained by inadequate uptake of at least one nutrient, and by inadequate uptake of more than one nutrient in almost half of the crops! These shortfalls in crop nutrition have previously gone undetected. Routine grain analysis and benchmarking in YEN Nutrition will identify those nutrients needing closer attention on each field and will thereby enable yield enhancements on most fields.
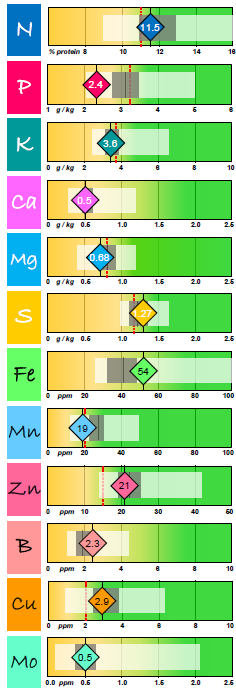 Benchmarking diagrams (as on the right) quickly show which nutrients were of most concern for each crop.
You can easily see the nutrients where the value for this field (diamonds) was less than the middle 50% of all other crops, and (if known) also less than the critical threshold (red dotted line). So, in this example (from 2019), yield appears to have been limited by P & Mn, and maybe also by K & Mg. However low values for K & Mg were common in this season, so are probably the result of climatic factors rather than site-specific management.
In this example grain analysis is indicating a need to examine soil P availability and (if satisfactory) to consider how P capture might be improved e.g. by increasing topsoil rooting. To increase Mn nutrition, early spring sprays could also be worthwhile, depending on monitoring by leaf analysis.
The approach of YEN Nutrition is that nutrients cannot be managed unless they are measured. Grain analysis provides full measurement of nutrient capture by each crop, so grain analysis fully augments soil analysis (which just indicates availability and only of a few nutrients) and leaf analysis (which indicates mid-season nutrient status). By combining the results of grain analysis with soil and leaf analyses you will be able to amass the evidence you need to diagnose which nutrients, fields and crops are most regularly of concern, and to draw up strategies that accordingly focus either on improving nutrient supplies or on improving rooting and nutrient capture.
A ‘YEN Nutrition Review’ will be provided to all YEN Nutrition participants annually after all results from the season are received and all data have been analysed (probably in February). With complete data on all nutrients, all yields, and information on all nutrient applications from thousands of fields, this will provide the first and best overview of seasonal crop nutrition that has ever been possible in the UK. The Review will examine the nutrients most commonly appearing to show deficiencies; it will confirm whether there were direct associations between nutrient levels and grain yields. Nutrients showing positive associations with yield are likely to be of most concern whereas nutrients showing negative associations with yield probably are showing ‘yield dilution’ and are of less concern. The review will discuss how the most common deficiencies are best corrected. It will explore which nutrients showed seasonal effects and whether there were any regional effects and/or differences between varieties. Lastly, the review will consider which are the main unknowns and uncertainties preventing optimisation of crop nutrition, therefore what tests need to be made to make faster progress in knowledge and management of crop nutrition throughout the UK.